Food Webs & Water Quality
Over the past 10 years, we have been monitoring and evaluating how water for the environment is being used to support food webs and water quality.
Image: Common Yabby (Cherax destructor) perched on a twig under the water. Photo credit: Adobe Stock Photos
Flows for food webs and water quality
Food webs offer a valuable framework for understanding life in rivers and wetlands, illustrating who eats whom—from microbes to Murray cod—and how energy flows through ecosystems. They highlight the roles of individual species and connections in sustaining ecological health. Measuring water quality helps us better understand changes in nutrient and oxygen availability, and how changes in these parameters affect the ecosystem.
The Food Webs and Water Quality Theme covered multiple components including the evaluation of stream metabolism, water quality and research on how environmental flows influence the flow of energy through food webs. This page provides key insights from these components for environmental water managers.
Note: The contents on this page includes summarised text from the following report: Basin-scale evaluation of 2023-24 Commonwealth environmental water: Food Webs and Water Quality. Page number references have been noted throughout the content below for anyone using the full report.
Our Approach
The evaluation component of our work analyses data and annual monitoring reports from 7 Selected Areas in the Murray–Darling Basin, from 2014–15 to 2023–24. The Research program has undertaken seven studies (published over two reports), to understand how environmental flows influence energy flow, and to build this understanding into a bioenergetics model that could simulate ecosystem responses. We have also included the implications of these findings for environmental water managers. Across both components, we focused on how environmental water contributes to changes in rates and patterns of:
- primary productivity
- ecosystem respiration
- dissolved oxygen levels
- salinity regimes.
Stream metabolism is used to assess the first three of these, with the latest findings based on data from the seven Selected Areas during the 2023–24 water year. The results are interpreted in the context of trends from 2014–15 to 2023–24. For this assessment, the ‘metabolic fingerprint’ approach was extended to identify shared metabolic responses to flow across all Selected Areas. This method improves correlations between flow and metabolism. It also visually indicates whether observed responses fall within a site’s typical metabolic range. The analysis draws on 24,621 daily records of gross primary production (GPP) and ecosystem respiration (ER) collected from 2014–15 to 2023–24, forming one of the world’s largest riverine metabolism datasets (pg. iv).
Introduction of Counterfactual Modelling (pg. 26)
In the 2023–24 year, we developed a counterfactual (without Commonwealth environmental water) model to estimate the contribution of Commonwealth environmental water to riverine GPP across the entire 2014-24 monitoring period. The dataset included 28 sites across 6 areas, totalling 99 year-site combinations and 16,629 daily GPP estimates. Briefly, this involved two steps:
We constructed a statistical model to describe how measured daily GPP responded to 2 known key drivers: solar radiation and flow. We hypothesised that solar radiation would linearly affect log-transformed GPP but that flow may have more complex non-linear effects.
We used the best fitted model to predict new time series of daily GPP at each site under both the predicted observed flow (with Commonwealth environmental water) and the predicted counterfactual flow (without Commonwealth environmental water). Predicted results were summarised to weekly means for visualisation.

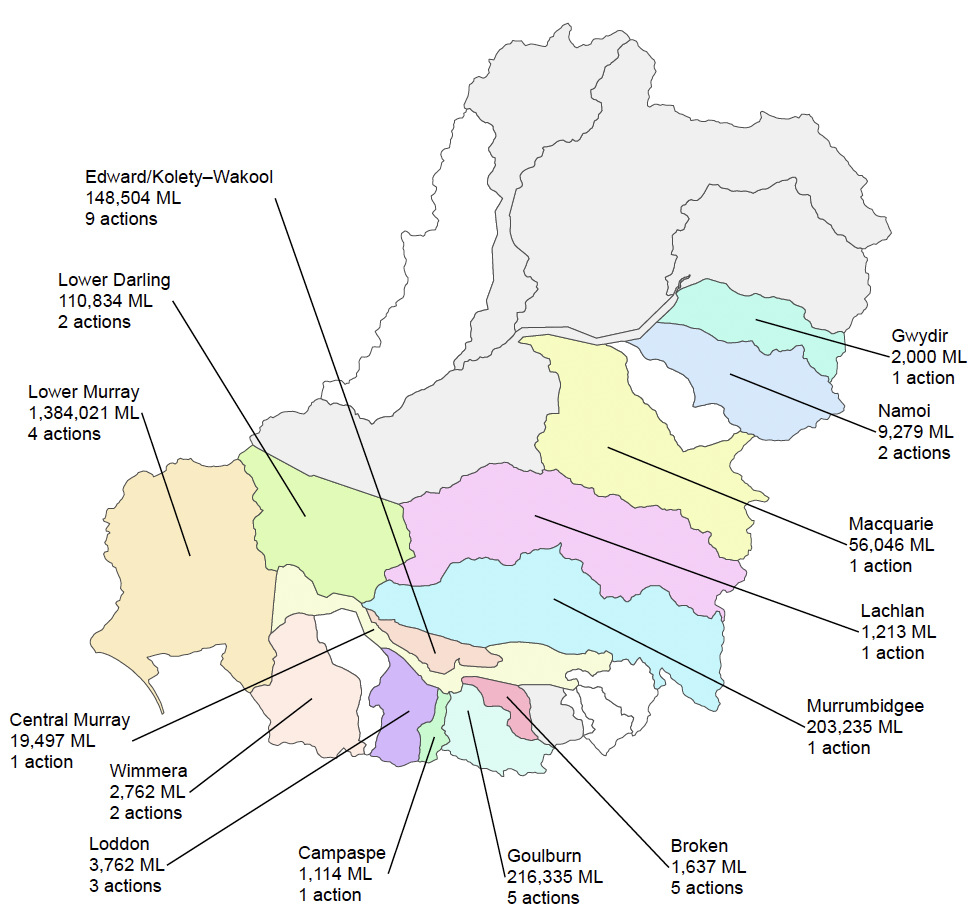
Volume of Commonwealth water for the environment delivered to Murray-Darling Basin regions
Commonwealth water for the environment is used to support food webs and water quality in different regions across the Basin. Learn how water was used in the 2023-24 year, and the outcomes it was designed to achieve.
Water for the environment supports key ecological processes including energy conversion, temperature regulation and decomposition by helping to maintain river function, ecosystem health, resilience, and productivity.
Water for the environment supports nutrient and carbon cycles by helping transfer energy and essential nutrients between organisms and their environment, which is vital for ecosystem productivity and health.
Water quality refers to the chemical, physical, and biological condition of water. Water for the environment can help maintain or enhance water quality to support diverse needs across the Basin.
Dissolved oxygen measures the oxygen available to aquatic life and indicates water quality. Water for the environment helps maintain oxygen levels and reduce the risk of hypoxic blackwater events.
Salinity refers to the amount of dissolved salt in water. Excess salt in freshwater can harm ecosystems, drinking water, and irrigation. Water for the environment can help wetlands recover from high salinity and support the movement and export of salt.
Water for the environment can help manage sediment by flushing fine particles, promoting biofilm growth, preventing sediment from settling on hard surfaces, and scouring excess sediment and biofilms when needed.
Stagnant water and stratification both reduce mixing in aquatic systems, limiting the distribution of oxygen, nutrients, and carbon. This can lead to depleted lower layers, creating hypoxic conditions that harm aquatic life.

Evaluation results
In this section the results from the evaluation component of the Food Webs and Water Quality Theme are provided, with findings linked to the achievement of Basin Plan objectives and the implications of this for environmental water managers. Based on 10 years of data, the metabolic fingerprints for each Area are also shared to demonstrate the impact of environmental water on gross primary production (GPP) and ecosystem respiration (ER). Evaluation summaries for dissolved oxygen and salinity then follow, with management implications highlighted.
Key contributions to the Basin Plan
(page 32-34)
8.06 (3) To protect and restore ecosystem function of water-dependent ecosystems. Relevant subclauses 8.06(3)(c) and 8.03(3)(d) are to protect and restore connectivity within and between water-dependent ecosystems by ensuring the Murray Mouth remains open frequently and long enough to allow the flow of salt, nutrients, and sediment to the ocean, and to support tidal exchanges that maintain the Coorong’s water quality, especially salinity, within resilient ecological limits.
Commonwealth environmental water played an important role in meeting long-term objectives to protect and restore connectivity within and between water-dependent ecosystems. Commonwealth environmental water can support heterotrophic production if it contributes to connectivity between river channels and floodplains by increasing the supply of allochthonous organic carbon to food webs.
8.06 (7) To protect and restore ecological community structure, species interactions and food webs that sustain water-dependent ecosystems, including by protecting and restoring energy, carbon and nutrient dynamics, primary production and respiration.
There is evidence from all Selected Areas that Commonwealth environmental water has had a positive influence on protecting and restoring energy, carbon and nutrient dynamics, primary production and respiration over the 10 years. For example, even when changes in rates of GPP and ER were small, the increase in water volume provided by Commonwealth environmental water increased total production and consumption of carbon in riverine food webs.
Objective 9.08 aims to (a) protect and restore water quality to support environmental, social, cultural, and economic values, and (b) manage salinity levels to ensure they remain within acceptable limits for both ecosystem health and human use.
Trends in water quality and relationships with environmental flow delivery are difficult to assess across the Basin due to the high level of spatial and temporal baseline variation and inadequate data to capture that variability. However, there is strong evidence that Commonwealth environmental water played an important role in maintaining water quality over the 10 years. Commonwealth environmental water also contributed to the objective of meeting salt export targets.
Objective 9.09 includes an objective to ensure sufficient salt is flushed from the River Murray System to the Southern Ocean, supporting water quality by requiring annual monitoring of salt export over the barrages. The salt export objective is to be achieved through the export of an average of 2 million tonnes of salt from the system each year.
Over the 10 years, Commonwealth environmental water was responsible for exporting over 4 million tonnes of salt exported through the barrages (around 22% of the Basin Plan target) and reducing salt import by more than 28 million tonnes.
Objective 9.14 (5) (c) sets targets for managing water flows to maintain dissolved oxygen at a minimum of 50% saturation and to ensure that salinity levels at reporting sites remain below target values at least 95% of the time.
When the addition of Commonwealth environmental water increased mean water velocities above ~0.18m/s in the Lower Murray River, it helped reduce the likelihood of low dissolved oxygen concentrations by increasing gas exchange at the water surface.
Objective 9.14 (5) (c)
The levels of salinity at the reporting sites set out in should not exceed the values below 95% of the time
Target values (electrical conductivity) (μS/cm):
- Murray River at Murray Bridge–830
- Murray River at Morgan–800
- Murray River at Lock 6–580
- Darling River at Burtundy–830
- Lower Lakes at Milang–1,000
Commonwealth environmental water contributed to maintenance of river salinity below 800μS/cm (electrical conductivity) at Morgan over the 10 years. Salinity was maintained within the range required for potable water in the Murray River over this period – water was about 10% fresher due to environmental flows.

Commonwealth environmental watering contributing to gross primary production
Counterfactual modelling across the entire 2014–24 dataset was used to estimate the contribution of Commonwealth environmental water to riverine GPP.
Summary of results 2014–24 (pg. 28)
Solar radiation increased GPP while flow proportion had highly non-linear effects on GPP. At lower flows (<20% of maximum site flow), flow had a strong negative effect of GPP. The flow component represented by approximately 20% of maximum flow will differ among sites but often corresponded to between a large fresh and bank full flows.
Similar negative effects of flows have been observed in many systems globally and may be due to disturbance, shading, or dilution effects. At higher flows, flow has a moderate but inconsistent positive effect on daily GPP. This is perhaps due to bank and floodplain inundation increasing nutrient availability or the amount of shallow well-lit wetted areas.
We assessed the effect of Commonwealth environmental water on riverine GPP by applying the solar radiation and flow relationships to all days under both the observed and counterfactual flow scenarios. By increasing flow, Commonwealth environmental water reduced annual riverine GPP across all sites and years.
The high variation in Commonwealth environmental water effect on annual GPP among sites and years was driven by variation in Commonwealth environmental water contribution to annual flow. Years with relatively more Commonwealth environmental water generally produced the largest predicted reductions in total annual GPP compared to the counterfactual.
Much less often, Commonwealth environmental water was predicted to have increased daily GPP rates.
Implications for e-water managers (pg. 31):
Riverine productivity regimes are sensitive to Commonwealth environmental water.
Delivering Commonwealth environmental water at flows lower than large freshes will generally reduce daily GPP (by a daily average of 15%), contributing to lower annual rates of productivity. This could potentially limit the prolife ration of some unwanted algal groups that can occur at low flows.
Interactions between solar radiation and flow drivers were not strong, indicating flow increases will reduce GPP by similar amounts at different times of year.
Commonwealth environmental water bolstered riverine GPP in rare instances where Commonwealth environmental water contributed to very high discharges (e.g. when extending a flood recession), supporting the boom–bust nature of the lowland river-floodplain systems.
Metabolic Fingerprints: Comparing 2023–24 patterns in metabolism at Selected Areas to the previous 9 years of data
(pg. 17-18)
Stream metabolism is a useful indicator of ecosystem processing rates, however, establishing desired ecological targets for river management can be complicated. Rates of gross primary production (GPP) and ecosystem respiration (ER) are highly context dependent and vary widely depending on the season or local biotic and abiotic attributes of rivers. More is not always better when it comes to stream metabolism; extremely high rates of GPP can be reflective of non-desirable cyanobacteria blooms, while extremely high rates of ER can be reflective of hypoxic blackwater.
With 10 years of stream metabolism data from across the Basin, we can now generate fingerprints for each Selected Area which represent the dominant metabolic pattern for that Area. The metabolic fingerprint represents the entire distribution of daily estimates of GPP and ER observed for a river. Using these, we can track metabolic responses to environmental flows and assess whether these responses are inside or outside of the typical or predicted responses. From this point, we can then ask the question, is the system usually heterotrophic (there is more consumption of carbon than there is biomass being produced i.e. ecosystem respiration > primary production) or autotrophic (there is more biomass being produced than is being consumed i.e. primary production > ecosystem respiration). This distinction provides insight into the balance of energy production and consumption, helping inform flow management decisions.
How to interpret the fingerprint
- The dashed line indicates when GPP and ER are equal (i.e. net ecosystem production equals zero).
- Above the dashed line, the system is heterotrophic (a net consumer of carbon; ER > GPP).
- Below the line, the system is autotrophic (a net accumulator of carbon; GPP > ER).
- Shaded blue area in the top left of the plot represents high ER and low GPP rates and can be indicative of blackwater or hypoxic events.
- Shaded blue area in the bottom right of the plot represent high GPP and low ER and may indicate algal blooms or eutrophication.
- Contour lines reflect the percentage of data points collected, with lines extending outside the central white band (solid lines) indicating potential non-desired shifts in metabolic patterns in response to changes in flow regime.

Metabolic fingerprints across Areas
The metabolic fingerprints developed for this evaluation are based on 24,621 daily records of GPP and ER from 2014–15 to 2023–24. This is one of the largest riverine metabolic datasets available in the world. As the fingerprints show, the metabolic regime for each Selected Area is context dependent, varying according to the magnitude of biotic and abiotic drivers at each location. Based on 10 years of stream metabolism data, the fingerprints below are representative of the dominant metabolic patterns at each Area. These visualisations can serve to compare and contrast the latest annual and flow-event-specific metabolic responses, including whether they fall inside or outside the envelope of typical conditions or predicted responses for each catchment.
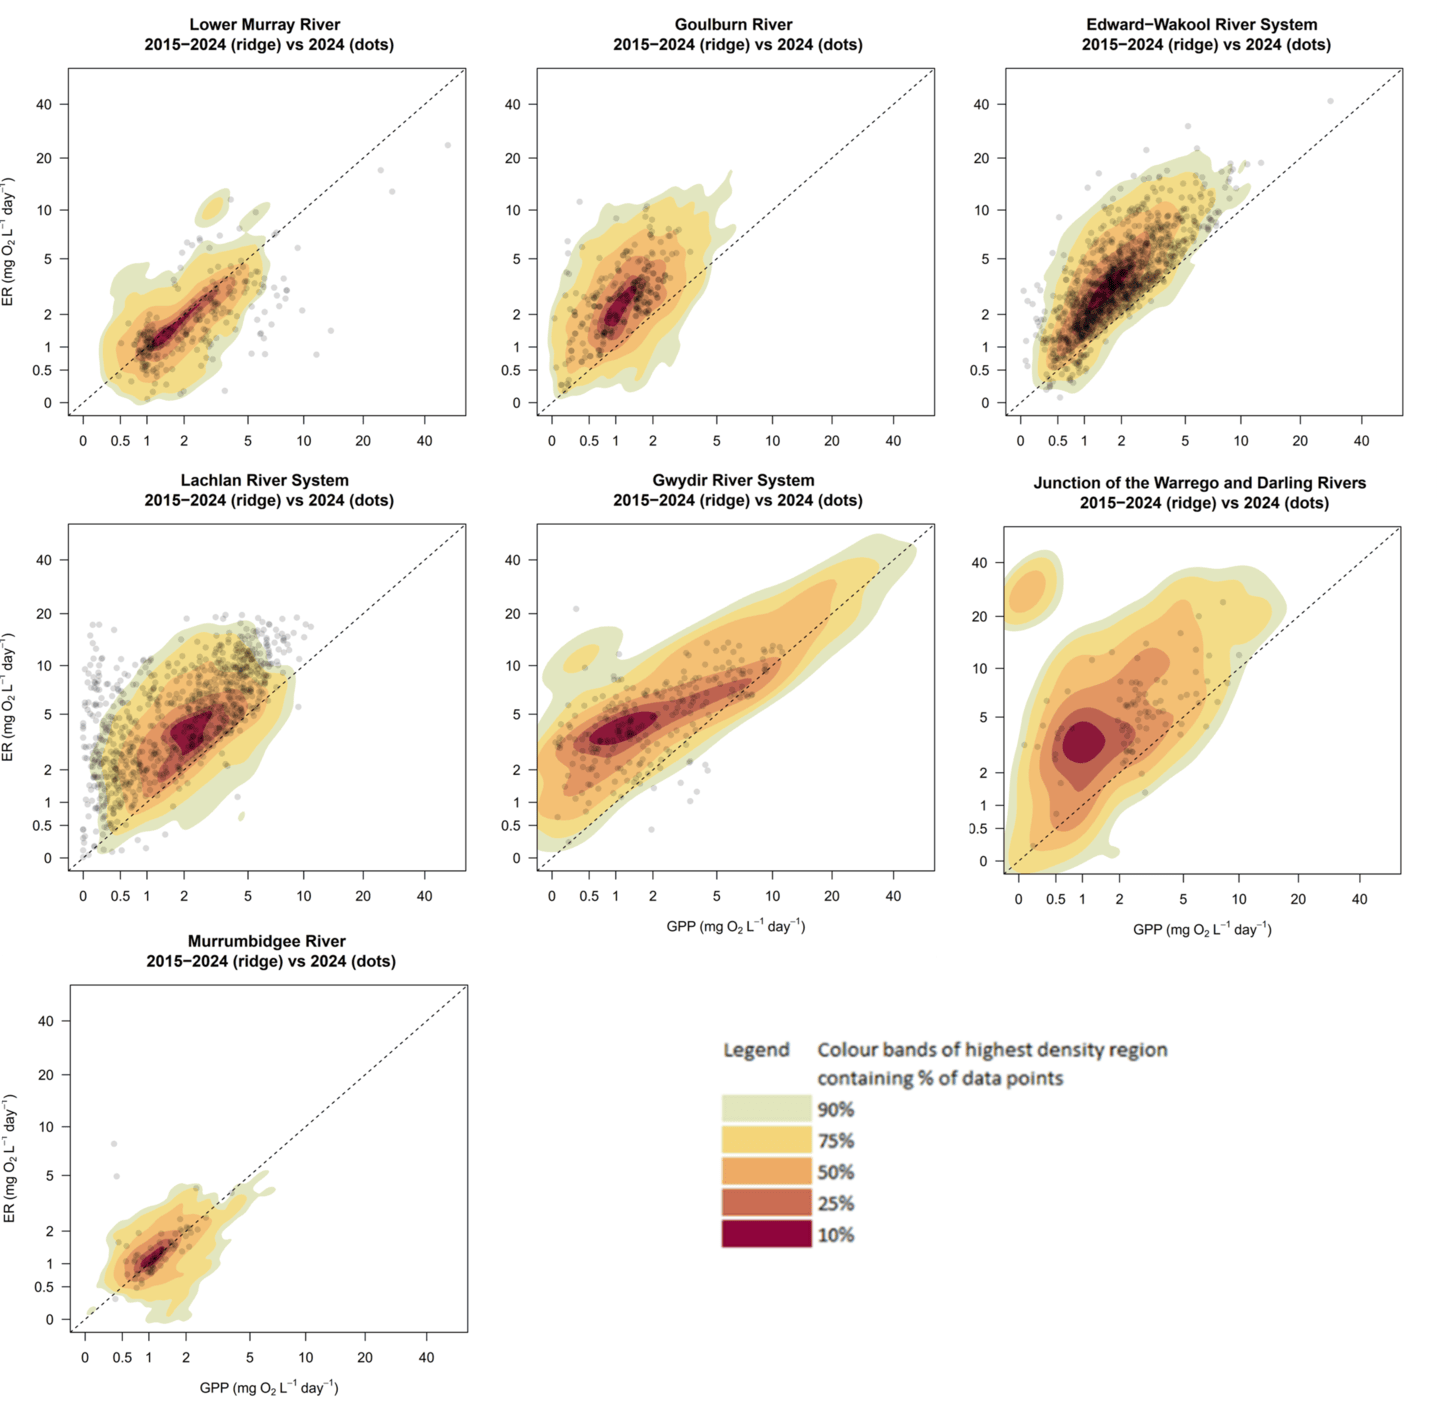
We focus on exploring metabolic responses to the full 2014–24 hydrological dataset (of which Commonwealth environmental water is a component). This is because we do not expect metabolic responses to flow to be sensitive to the purpose of the flow (e.g. environment, irrigation supply) and this approach provides much greater statistical power. The 2014–23 metabolic fingerprints for Selected Areas overlaid with the 2023–24 metabolic data points show:
- Metabolic responses to flow in the Edward/Kolety–Wakool river systems are consistent – most locations responded to increased flows with significant increases in ER and decreases in GPP
- Metabolic responses to flow in the Murrumbidgee River System at McKennas are dominated by small but significant increases in GPP
- Metabolic responses to flow in the Lachlan River System are significant at all sites–overall metabolic throughput decreased at most locations.
- Contrasting metabolic responses to flow at 2 geographically similar sites in the Goulburn River highlighted the high level of context dependency that can exist within Selected Areas:
- At the Loch Garry gauge, increased flow drives a relatively strong reduction in GPP.
- At McCoys Bridge, increased flow reduces both rates of ER and GPP, with the arrow pointing down the diagonal line.
- At the Loch Garry gauge, increased flow drives a relatively strong reduction in GPP.
- In the Lower Murray River, the dominant metabolic response among all sites to increased flow is a decrease in GPP and slight increase in ER.
Water use for Dissolved Oxygen and Salinity
The evaluation of water quality draws on information provided by Selected Areas.
Dissolved oxygen (DO)
Commonwealth environmental water is very important for decreasing the likelihood of low DO because it can increase water mixing and oxygen exchange at the surface, particularly in the Lower Murray River Selected Area, where the river is dominated by slow-flowing locks and weirs. These flows can act to dilute hypoxic water with oxygenated water and increase oxygen exchange at the surface. Commonwealth environmental water may also be used to maintain base flows to support aquatic ecosystems during low flow periods (pg. 37).
Over the 10 years, Commonwealth environmental water contributed to decreasing the likelihood of low dissolved oxygen in the Lower Murray River through maintaining flow velocities above 0.18 m/s. Flow velocities above this threshold increase water mixing and oxygen exchange at the surface. Below this velocity, surface oxygen exchange is poor.
Salinity (pg. 14, 25)
The Basin-scale Food Webs and Water Quality Theme reported on the contribution of Commonwealth environmental water to the export and import of salt through the Murray Mouth.
- In 2023–24, Commonwealth environmental water was responsible for the export of 221,272 tonnes of salt (17.8% of total salt exported) through the barrages.
- Commonwealth environmental water decreased salt import at the Murray Mouth by approximately 2,854,965 tonnes in 2023–24.
- Over the ten years, Commonwealth environmental water was responsible for an additional 4.37 million tonnes of salt exported through the barrages and for a reduction in salt import by almost 29 million tonnes.
- Commonwealth environmental water has played a key role in salt export from the Basin; however, salt export remains below the Basin Plan target of 2 million tonnes per year.
Table 1: Ten-year summary of modelled salt export and reduced salt import attributable to Commonwealth environmental water at the Coorong and Murray Mouth
Note: Salt export and salinity estimates 2014–17 are from the large domain model previously used in the Long Term Intervention Monitoring reporting. Results from 2017–18 are from the new high-resolution Coorong-only model, which uses a different method for barrage flow calculation and has a more accurate specification of salinity and salt flux. (Source: Ye et al. 2024)

Research results
Understanding energy flow through ecosystems is critical for understanding patterns of biodiversity and ecosystem function. Alteration of riverine flows can modify the structure and function of ecosystems, changing the availability and quality of food for animals. In 2020–23 and again in 2025, we undertook research to improve our understanding of the complex relationship between hydrology and aquatic food webs. Our findings are summarised below, along with the implications of findings for environmental water and policy managers.
The aim of this research component was to understand how the bioavailability of dissolved organic carbon (DOC)—that is, the extent to which this carbon can be readily used by microorganisms as an energy source—changes during a large overbank flood event, and what this means for food web productivity. Laboratory analysis of DOC was conducted on water samples collected from sites on the lower Namoi and Mehi Rivers, and upstream and downstream of their confluences with the Barwon River (six sites in total; see Figure 1) on four occasions between April and June 2021. This sampling period captured a significant overbank flood that peaked in late April 2021 (page 3).

Findings
(page 4)
Our research showed that overbank flooding mobilised substantial loads of organic matter as floodwaters inundated floodplains that had not been flooded since 2012. Key insights were that dissolved organic carbon concentrations:
- followed a similar pattern at all 6 study sites.
- increased on the rising limb of the flood and peaked on the falling flood waters (Figure 2).
- were lowest at all sites once conditions had returned to low flows (June 2021; Figure 2).
Bioavailability of dissolved organic carbon was highest during the rising limb of the flood at five of the six sites, ranging from 20–32%. The exception was the Barwon River site upstream of the Namoi confluence, where bioavailability peaked later, during the falling limb in late April. Once flows receded, bioavailability decreased across all sites, dropping to 5–15%.

(page 5)
These results highlight the critical role of high flow events and the need for flow management rules—such as those enabling the shepherding of environmental flows and maintaining end-of-system flows—that support both lateral and longitudinal connectivity. Such connectivity is essential for the cycling of organic matter within river systems.
An increase in bioavailable dissolved organic carbon during these events can significantly boost energy resources for secondary consumers like zooplankton, which are vital to aquatic food webs as a primary food source for many juvenile and small-bodied fish.
The study also underscores the importance of tributary inputs from northern catchments into the Barwon-Darling system. Notably, the Mehi River contributed 65% of the flow volume downstream of its confluence, while the Namoi contributed up to 40% downstream of its own confluence. These inputs provide a substantial volume of water and foundational resources, such as organic matter, that support ecosystem productivity.
The aim of this research component was to determine if changes to river flows affect the growth of larval golden perch. Eighty golden perch larvae were raised in tanks on a diet of zooplankton, over 11 days in Dec-Jan 2020–21. Half of the 32 tanks were randomly assigned as controls, whilst terrestrial organic matter solution was added to the others to mimic organic input from higher flow events. Water samples were taken for dissolved nutrient and zooplankton measurements, and fish weight and length were measured. Stable isotopes of carbon-13 were used to measure energy transfer from zooplankton to fish (page 6).
Findings
(page 7-8)
This study shows that increasing terrestrial organic matter (which occurs during flows), will enhance zooplankton density and fish growth (see Figure 1 & 2), specifically:
- The tanks containing terrestrial organic matter had significantly higher concentrations of organic carbon, nitrogen and phosphorus.
- The addition of terrestrial organic matter led to significantly higher numbers of zooplankton.
- Zooplankton population significantly reduced after the addition of golden perch, showcasing high predation.
- Fish length, width and eye diameter increased when terrestrial organic matter was added.
- Carbon-13 isotope results showed greater enrichment in treatment tanks, indicating assimilation of terrestrial organic matter into fish biomass.

(page 9)
Flow events must connect with sources of terrestrial organic matter to stimulate the production of microzooplankton, which are a critical food source for newly hatched fish larvae. These early-life stages are particularly sensitive to food availability, and without sufficient microzooplankton production, larval survival can be severely limited. Higher-volume flows are also likely to benefit larval golden perch by improving access to food, dispersing larvae into suitable habitats, and supporting their growth through to the juvenile stage.
The survival of larval fish is closely tied to both prey density and the risk of predation. Growth during these early stages is crucial; larger larvae are better able to evade predators and exploit a broader range of prey. This means that food availability during early development is not just a matter of growth—it can determine whether fish survive and successfully recruit into adult populations.
From a management perspective, these findings highlight the importance of delivering flow events that not only provide water but also maintain or restore connectivity with floodplain and riparian zones rich in organic matter. Such connectivity ensures the delivery of energy and nutrients that drive zooplankton production and support aquatic food webs. Protecting and timing higher-volume flows to coincide with fish spawning periods can enhance recruitment success by aligning critical ecological processes—like organic matter mobilisation and zooplankton production—with the nutritional needs of developing larvae. These insights reinforce the need for integrated flow management that considers not just the quantity and timing of water delivery, but also its ecological quality and spatial reach across river-floodplain systems.
The aim of this research component was to determine if organic carbon subsidies will increase secondary production or change the structure of freshwater food webs. A month-long mesocosm study was completed using 8 x 2,000 litre circulating mesocosms. All mesocosms contained a gentle flow rate and half were treated with terrestrial organic matter to mimic organic input from higher flow events. 100 golden perch larvae were added to each tank. Samples of water quality indicators, bacteria, ciliates, and zooplankton were taken and fish were measured in weight and length. A heatwave during the experiment saw significant shifts in the production of algae and plankton (page 11).
Findings
(page 12-13)
- Bacteria, ciliates, and smaller zooplankton abundance were significantly higher in mesocosms with terrestrial organic matter, although larger zooplankton such as copepods varied throughout the experiment.
- The weight and length of golden perch larvae was significantly higher for fish in the treatment ponds.
- The heatwave coincided with algal blooms and high chlorophyll a concentrations in both treatment and control ponds, although chlorophyll a concentrations were higher in the treatment ponds by the end of the experiment.
- The heatwave also saw increases in zooplankton across all ponds, compared to the first two weeks.
This study (Figure 1) showed that terrestrial organic matter led to increased energy moving through the food web through bacteria and secondary consumers. The heatwave highlighted how quickly shifts in basal resources can occur in warm, hot conditions, including through increases in algae and chlorophyll a, and zooplankton.

(page 14)
This study highlights the critical role of environmental flows in supporting basal production during the early life stages of both invertebrates and native fish. Pulses of organic carbon delivered through flow events can significantly enhance secondary production by fueling the growth of zooplankton and other small organisms that form the foundation of aquatic food webs.
Importantly, even relatively small increases in productivity at the base of the food web can lead to substantial gains in biomass at higher trophic levels. In this case, enhanced food availability contributed to increased growth and survival of golden perch larvae, demonstrating the cascading benefits of organic carbon inputs.
Additionally, a natural heat wave during the experiment triggered algal growth in both control and treatment ponds, mirroring conditions often observed in the wild. This suggests that the observed dynamics are relevant to real-world ecosystems and not just confined to experimental conditions.
For environmental water managers, these findings underscore the importance of designing flow regimes that not only deliver water but also restore ecological processes—particularly the transport of organic matter from floodplains and upstream catchments into river systems. Strategic timing of flow events to coincide with critical life stages of aquatic organisms can maximise the ecological return on environmental water investments. Enhancing basal food production through well-timed flow pulses may be a powerful tool to support the recovery and sustainability of native fish populations such as golden perch.
The aim of this research component was to determine how flooding different riverbank heights influences zooplankton and organic matter loads. In February 2022, we ran a 4-week mesocosm experiment using sediment from different bank heights of the Mehi River, NSW. Transects were used to collect leaf litter and sediment. Percentage cover of leaves, twigs, bark, live plants and soil was measured using quadrats. We used 30 mesocosms with a gentle flow. We added sediment and sampled water quality indicators and zooplankton. Results were used to model zooplankton input from riverbanks under different flow scenarios (pages 15-16).
Findings:
(pages 17-18)
- Organic matter and leaf litter were significantly higher on the upper banks. This led to higher concentrations of organic carbon and phosphorus.
- Chlorophyll a was higher in the mesocosms receiving sediment from lower banks compared to higher banks.
- Turbidity was significantly higher in treatments receiving sediment from the lower bank. This suggests the higher algae concentrations are likely the result of more viable algae inhabiting lower banks.
- Zooplankton abundance was significantly higher in the treatment receiving sediment from the upper bank followed by the middle bank.
- Modelling of different flow scenarios showed more zooplankton were contributed from the riverbanks under the with Commonwealth environmental water scenario compared to the without scenario.
(see Figures 1 & 2)


(page 18-19)
Our experiment demonstrated that in-channel flows which reach higher sections of the riverbank can significantly enhance food web productivity. These flows mobilise organic matter and nutrients that support the growth of zooplankton and other key components of the aquatic food web.
Importantly, the findings show that even when flows do not reach the broader floodplain, there are still substantial ecological benefits from inundating higher riverbank areas. This highlights the value of protecting and providing in-channel flows as a management strategy—not just for maintaining connectivity, but also for supporting energy transfer and biological productivity within the river ecosystem.
For water managers, this means that environmental water delivery should not be limited to large overbank events. Smaller, well-timed in-channel flows that inundate bank features can play a vital role in sustaining aquatic food webs and supporting the growth and survival of native fish and invertebrates. Incorporating these types of flow targets into environmental water planning could improve ecosystem outcomes even in dry years or under constrained water availability.
The aim of this research component was to understand how environmental water influences structure and function of riverine food webs. The Ecopath with Ecosim (EwE) ecosystem modelling framework was applied to the Lachlan River System. The model describes the production and balance of energy over time. Data from Flow-MER and LTIM monitoring programs, as well as local studies were used in this modelling. A total of 25 functional groups were used including 19 animal consumer, 3 primary producers and 3 detrital groups. We modelled food web responses under different flow scenarios (pages 20-21).
Findings:
(pages 22-23)
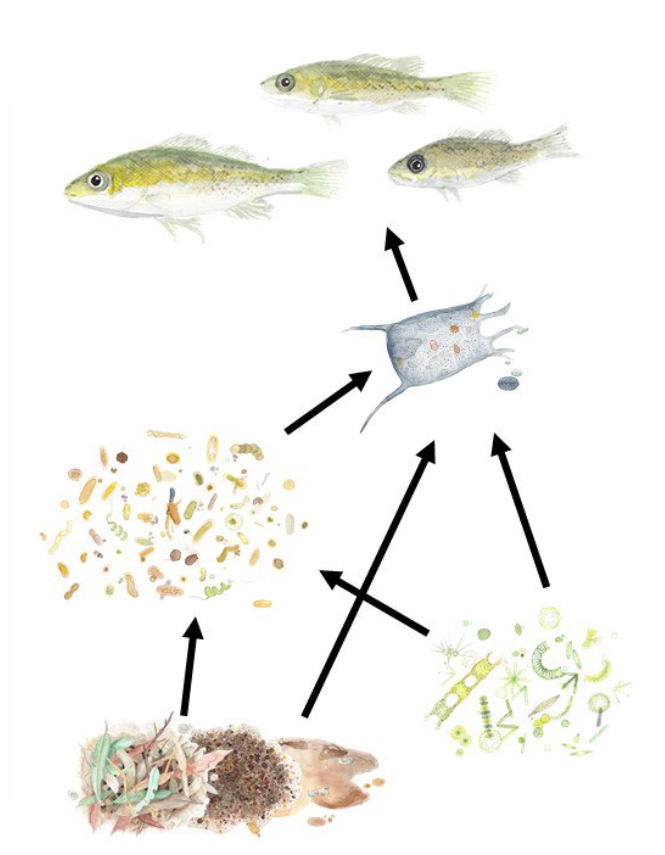
- In the Lachlan River system, energy flow was distributed as follows: 46% went to consumption by organisms, 35% was lost to detritus, and 19% to respiration. Organisms in the food web were grouped into different trophic levels based on how many steps energy takes to reach them, with producers and detritus forming the base at level 1. Most fish species occupied level 3, with the exception of common carp and bony bream, which were at lower levels due to their feeding habits.
- Birds, Murray cod, and golden perch had the highest number of energy pathways, receiving energy from 144, 106, and 77 different sources respectively, highlighting their broad dietary roles in the ecosystem. Overall, 71% of energy within the system originated from detrital pathways—energy derived from dead organic matter—primarily through microbial processing. This type of energy source is known as allochthonous organic material, meaning it originates outside the aquatic system, such as leaves, soil, or plant matter washed in from the surrounding landscape.
- Several taxa had a disproportionately large influence on the food web relative to their biomass, notably decapods (e.g. freshwater prawns or crayfish), Murray cod, bony bream, and mesozooplankton. These groups play key roles in transferring energy through the food web.
- Large in-channel flows in spring 2020 and spring 2021 enhanced primary production and delivered substantial inputs of allochthonous organic matter. These flows increased wetted habitat across off-channel and floodplain areas, supporting a marked rise in consumer biomass. Decapods, in particular, showed substantial population increases following flooding at the end of 2021, likely in response to the surge in periphyton and particulate organic matter—both important food sources.
- The boost in basal resources after these flow events led to a corresponding increase in fish biomass. A comparison of model scenarios with and without Commonwealth environmental water show a modest but clear improvement in native fish abundance over the five-year (2017–21) study period.
See Figures 1 & 2


(page 25)
Commonwealth environmental water has been shown to enhance productivity within the Lachlan River food webs by increasing the availability of energy and resources that support higher trophic levels, including native fish. Assessing these outcomes at the ecosystem scale through food web modelling provides a valuable and practical tool for informing adaptive management. This approach allows managers to evaluate how flow interventions influence the structure and function of aquatic ecosystems, helping to guide future water planning decisions.
A key limitation of current modelling efforts, however, is the lack of long-term time series data, particularly for key functional groups within the food web. To improve the accuracy and usefulness of food web models, it is essential to incorporate regular monitoring of biomass for keystone taxa such as decapods and zooplankton. These organisms play a critical role in transferring energy through the food web and supporting the growth and survival of higher-level consumers like fish and birds.
For water managers, this highlights the need to not only deliver environmental flows but also to invest in robust ecological monitoring programs. Targeted data collection on the abundance and biomass of key taxa will strengthen predictive modelling and support more effective, evidence-based decisions in the management of environmental water.
The aim of this research component was to assess how different hydrological conditions changed resource availability to wetland birds. We used a case study investigating the Hattah Lakes wetlands. Sampling sites were established at 5 lakes and sampling occurred from February 2023 to April 2023. Sampling occurred 2–3 times at each lake. Samples were taken for dissolved organic carbon, phytoplankton, benthic algae, zooplankton, macroinvertebrates, decapods, and small-bodied fish. Aquatic vegetation and bird surveys were also performed (page 26). (See Figure 1)
Findings:
(pages 27-28)
- Dissolved organic carbon biomass was higher in summer than autumn at all lakes.
- Overall phytoplankton biomass was very high and can be considered highly eutrophic.
- The highest biomass was recorded at Lake Hattah in summer and Lake Cantala in both summer and autumn.
- Benthic algal biomass was also high, with higher biomass recorded in autumn for Lakes Hattah, Cantala and Kramen compared to summer, whilst biomass at Lakes Mournpall and Bitterang remained consistent between seasons.
- Zooplankton biomass varied between lakes and seasons. The highest microzooplankton and mesozooplankton biomass was at Lake Cantala.
- Macroinvertebrate biomass was dominated by water boatmen (Corixidae) at all lakes.
- Decapod biomass was dominated by freshwater shrimp (Paratya australiensis), with smaller numbers of freshwater prawn (Macrobrachium australiense) also present.
- Fish biomass varied significantly between lakes and seasons. Fish biomass was very high in summer at Lakes Hattah, Mournpall and Cantala compared to other lakes and times and was overwhelmingly dominated by carp gudgeon (Hypseleotris sp.). Carp gudgeon were rarely present in autumn and Australian smelt (Retropinna semoni) was the dominant small-bodied fish in most lakes.
- Hattah Lakes food web is shown in Figure 2.


(pages 29-30)
Differences in food web structure appear to influence the composition of waterbird communities across the Hattah Lakes system, with notable effects observed at Lake Cantala. At Lake Hattah, the relatively large population of nankeen night herons is likely linked to the availability of food resources such as fish and decapods, highlighting the importance of prey abundance in supporting waterbird populations.
Inundation of the broader wetland area significantly boosts food web productivity. When the lakes were fuller during summer, fish and decapod biomass were generally higher compared to autumn, providing more abundant food for waterbirds during critical periods of breeding and feeding.
Applying basic food web modelling offers a valuable tool for understanding how different environmental watering scenarios affect the availability of resources for waterbirds. This approach can help predict which waterbird species are likely to benefit from specific flow regimes and identify which habitats and food sources are most responsive to inundation.
For wetland and water managers, these findings underscore the importance of timing and extent of inundation in shaping food availability for birds. Strategic delivery of environmental water that ensures broader wetland flooding—especially in spring and early summer—can enhance food web productivity and better support diverse and abundant waterbird populations. Incorporating food web modelling into planning processes can improve the targeting of flows to achieve specific ecological outcomes for both aquatic and avian species.
The Murray River's food web is incredibly diverse, encompassing all organisms from microscopic algae and bacteria at its base to its most iconic top predators, such as the Murray cod. Flow-MER researchers have explored how the Murray River’s food web responds to changes in river flows over decades. The aim of this research was to generalise the bioenergetics model developed for the Lachlan River system by applying it to reaches of the Murray River, linking basal production and higher trophic-level biomass.
Using historical and recent data, we modelled how energy moves through the river’s ecosystem, and how flows affect the food web. We built four food web models for a 45-year period for four reaches of the river, spanning nearly 2,200 km from the Hume Dam in New South Wales to Wellington in South Australia.
Findings:
- Ecosystem biomass varied between years. The highest food web biomass typically occurred in years with high flows. The lowest biomass occurred during the Millennium drought.
- The food web varied between the four reaches of the Murray River. The most upstream reach, Hume Dam to Torrumbarry, had the lowest food web biomass and primary production. The most downstream reach, from Lock 6 to Wellington, had the highest primary production and overall biomass and the highest variation in biomass.
- Biomass of both Murray cod and golden perch remained relatively consistent across the 45 years. A decline between 2000 and 2010 was followed by recovery and an increase in biomass.
- The four food web models fit relatively well with observed data. Predictions of fish biomass in the Murray River were consistent with other estimates and studies.
- The results indicate that modelling food web dynamics is a valuable way to understand whole-of-system changes in biomass at the Basin scale.
The outputs of this research demonstrate that a food web modelling approach is a helpful way to understand the ecological responses to Commonwealth environmental water in the Murray River. We have shown how the modelling framework (Ecopath) can be used to link changes in biomass of basal resources at the bottom of the food web with shifts in biomass of apex predators, such as fish, at the top of the food web.
The models identify river discharge and volume as primary factors influencing the availability of basal food resources in the Murray River. Thus, hydrological scenario modelling can be used to test various potential water-management strategies. Our results suggest that food web dynamics are a driving process controlling fish populations in the Murray River.
When planning environmental flows for desired fish-conservation outcomes, food web interactions need to be viewed alongside other controlling factors, such as spawning, habitat and population connectivity. Considerations of food webs have often been omitted from evaluation approaches in environmental monitoring programs in favour of structural evaluation metrics (e.g. number of plants or individual animals).